

David Brett, an investment writer at Schroders, looks at which UK stockmarket sectors could have grown your money the most over the last 20 years, and what their valuations are telling us now.
- Over the last two decades, eight of the ten main UK sectors would have grown your investment
- Only one sector would have lost money – the financial sector, with a £1,000 investment becoming £623
- On current P/Es telecoms, consumer staples and technology are trading at a premium to their historical averages
When the stockmarket rises and falls the sectors within it can move very differently, especially in the short-term.
Perhaps the best example was the dotcom boom and bust, when technology shares soared in 1999 and then spectacularly crashed in the three years that followed.
A balanced and carefully managed portfolio can ease the impact of such irrational exuberance, especially as spotting bubbles is notoriously difficult.
Here, we look at which stockmarket sectors have performed best over a much longer timeframe - and where value might exist for investors today.
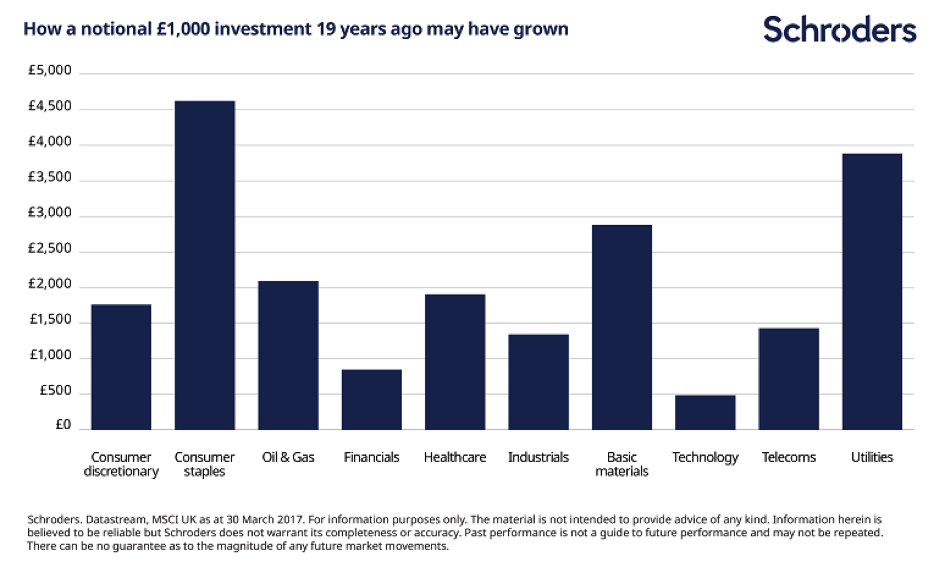
The sectors that performed best and worst since 1998
Schroders research shows that over the last 19 years (the longest length of time for complete UK sector data on Datastream), eight of the ten main UK sectors would have grown your investment. This period includes major bull markets and two big stockmarket crashes.
The consumer staples sector, which includes firms that produce household goods such as cleaning products, would have grown your money the most.
“If you had invested in the technology or financial sectors your money would have shrunk. Again, £1,000 invested in each sector in March 1998 would now be worth £486 and £845, respectively.”
A national sum of £1,000 invested in the sector on 30 March 1998 would now be worth £4,623, based on reinvesting dividends and taking inflation into account.
Utilities, which include water providers, performed well too with £1,000 growing to £3,884.
To produce the chart below, we looked at data for the ten broadest sectors in the UK as defined by the MSCI, sourced from Datastream.
It pays to be actively involved in managing your investments. Not all stockmarket sectors would have grown your money.
If you had invested in the technology or financial sectors your money would have shrunk. Again, £1,000 invested in each sector in March 1998 would now be worth £486 and £845, respectively.
The reasons for the winners and losers
Over the last 20 years the UK stockmarket has suffered extreme peaks and troughs.
The FTSE 100 hit an all-time closing high of 6,930.20 on 30 December 1999. Few could have predicted then that we would not see that level reached again for another 17 years.
The intervening years were a rollercoaster ride for the UK stockmarket. The dotcom boom and the global financial crisis contributed to the index’s highs and lows.
Those two events go a long way to explain why consumer staples and utilities outperformed while financials and technology shares lagged during that period.
Consumer staples and utilities are considered defensive shares. In turbulent times they are regarded as a more reliable source of income due to the nature of their businesses, which remain in demand even during difficult times. Energy and everyday goods always see steady demand.
Meanwhile, investors largely deserted technology stocks and financials - the two sectors most directly affected by the two major events.
Has anything changed in the last decade?
Narrowing the data down to the last 10 years tells a different story. Over the last decade, only one sector would have lost money – the financial sector, with a £1,000 investment becoming £623. HSBC, Lloyds Banking Group and Prudential are among the sector’s biggest stocks.
Defensive shares were among the winners again, popular in the turmoil and then uncertainty following the 2008-09 financial crash. A £1,000 investment in consumer staples on 30 March 2006 would have grown to £2,404.
The biggest stocks in this sector include Unilever, which is behind the Flora, Persil and Magnum brands, and Reckitt Benckiser, which sells everything from Dettol to Vanish.
The same amount invested in utilities and healthcare during the same period would have grown to £1,674 and £1,967, respectively.
Perhaps of most note is the performance of technology stocks. They slowly began to recover from the dotcom crash, amid much restructuring, and the stronger businesses thrived.
It means that £1,000 invested in 2006 would have grown to £2,836. The largest stocks in the sector include business software services firm Sage and online payments services provider Worldpay.
Which sectors should I consider in the next ten years?
It is impossible to predict the future of stockmarkets and, of course, past performance does not offer an indication of future performance.
What we can do is look at current valuations and try to gauge which areas of the market look potentially better value.
One way to value individual shares or the stockmarket as a whole is to compare share prices and earnings in a price-to-earnings ratio (P/E). A lower P/E ratio suggests better value.
On current P/Es telecoms, consumer staples and technology are trading at a premium to their historical averages.
Healthcare, energy and materials look better value on a P/E basis.
This basic analysis offers food for thought and is not meant to be a recommendation.
Fund managers mostly prefer to select stocks on a case by case basis after screening a wide variety of measures.
-
David Brett is an investment writer at Schroders.
Important information:
The views and opinions contained herein are those of the author(s) on this page, and may not necessarily represent views expressed or reflected in other Schroders communications, strategies or funds. This material is intended to be for information purposes only and is not intended as promotional material in any respect. The material is not intended as an offer or solicitation for the purchase or sale of any financial instrument. It is not intended to provide and should not be relied on for accounting, legal or tax advice, or investment recommendations. Reliance should not be placed on the views and information in this document when taking individual investment and/or strategic decisions. Past performance is not a reliable indicator of future results. The value of an investment can go down as well as up and is not guaranteed. All investments involve risks including the risk of possible loss of principal. Information herein is believed to be reliable but Schroders does not warrant its completeness or accuracy. Some information quoted was obtained from external sources we consider to be reliable. No responsibility can be accepted for errors of fact obtained from third parties, and this data may change with market conditions. This does not exclude any duty or liability that Schroders has to its customers under any regulatory system. Regions/ sectors shown for illustrative purposes only and should not be viewed as a recommendation to buy/sell. The opinions in this material include some forecasted views. We believe we are basing our expectations and beliefs on reasonable assumptions within the bounds of what we currently know. However, there is no guarantee than any forecasts or opinions will be realised. These views and opinions may change. To the extent that you are in North America, this content is issued by Schroder Investment Management North America Inc., an indirect wholly owned subsidiary of Schroders plc and SEC registered adviser providing asset management products and services to clients in the US and Canada. For all other users, this content is issued by Schroder Investment Management Limited, 31 Gresham Street, London, EC2V 7QA. Registered No. 1893220 England. Authorised and regulated by the Financial Conduct Authority.