
As the end of the year approaches, investors may wonder about the prospects for 2018. This month, we look at the yield curve gap for the US and 8 other major economies. The yield curve gap has been a strong and leading predictor of previous recessions.
We show that the yield curve is still around a year away from flattening in the US market and could take even longer in other major economies. Previous recessions have occurred around 1 year after the yield curve has flattened, suggesting that the risk of a recession is muted at present.
Key issues this month:
- The US Yield Curve gap is +0.64% suggesting that a recession is not imminent.
- The last 3 recessions have occurred after the yield curve has flattened with a 1-year lag.
- Looking internationally, Japan, Canada and China have the flattest yield curves.
The US Yield Curve
We begin with an examination of the US Yield Curve as this is the biggest economy and it can often lead other economies such as the UK. The chart below shows the yield curve gap for the US economy, calculated by subtracting the yield on 10-year US treasury bonds from the yield on 2-year treasury bonds.
The chart features a total of 4 previous recessions (treating the early 80’s double dip as a single recession), shown by the shaded grey bars. Each of the previous 4 recessions have been preceded by a flattening of the yield curve. The yield curve tends to be flat at these times for two reasons. Firstly, the Federal Reserve is often in tightening mode at the end of the economic cycle, which causes short-term rates to be higher than usual. Secondly, concerns about economic growth towards the end of the cycle tend to reduce long-term rates below their normal level. The combination of upward pressure on short-term rates and downward pressure on long-term rates leads to a flattening of the curve.
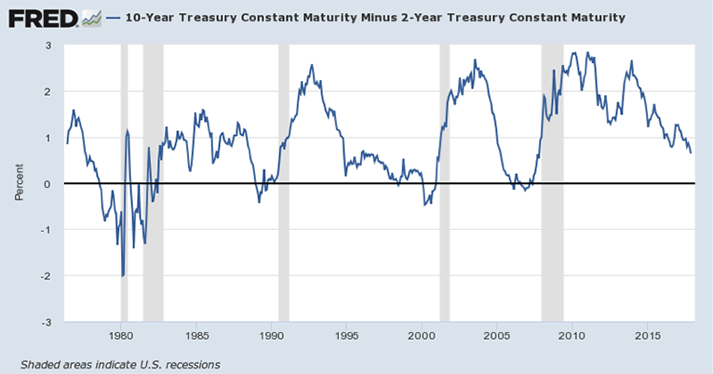
Figure 1: Chart Generated from FRED database
The current yield curve gap of +0.64% is well above the levels which have triggered a recession in the past. A flat yield curve has been a precondition of the last 4 recessions shown in the chart. In terms of movement, the yield curve is clearly heading in the direction of flattening. Last year the gap was +1.25%, so the gap is likely to close by the end of next year based on the current rate of movement. Evidence from the last 4 recessions suggests that a bottoming out of the yield curve is a forward indicator of a recession, with a lag of around 1 year. This makes the yield curve useful for prediction as a forward indicator. Given that the yield curve is still in the process of bottoming and is still in positive territory, a recession seems someway off unless a dramatic tightening occurs next year.
Other Major Economies
In this section, we look at 8 major countries, or economic areas in the case of the Euro, in terms of GDP. The table below shows the 10-year and 2-year bond yields for each country, along with the yield curve gap which is again calculated by subtracting the 2-year yield from the 10-year yield. The countries are sorted by reverse order in terms of yield curve gap.
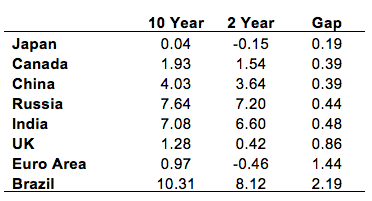
None of the yield curves of the major economies above are flagging an imminent risk of recession, as all countries have a positive yield curve gap. Japan has the smallest yield curve gap of them all, but has not moved since last year. The UK yield curve gap has narrowed from last year when it was around the same level of the US at 1.25%. At 0.86% is still does not suggest a recession and the UK curve has not tightened as much as the US this year. This reflects more aggressive central bank policy in the US than we have seen from the Bank of England.
The Euro Area and Brazil appear to be the strongest regions. Brazil has extremely high nominal rates due to a history of high inflation and large current account imbalances and it also has a high gap between the rates. In contrast, the Euro area has very low nominal rates, but also has a healthy gap between the two rates due to a very low short-term rate.
Conclusion
This particular business cycle has been quite unique in that it has lasted for so long. The evidence from the yield curve suggests that it still has some way to go. Japan is flagged as the country most likely to enter a recession, although there has been no change in the Japanese yield curve this year. In contrast, the US yield curve gap has narrowed considerably. Based on current trends, we would expect the US yield curve to be flat by the end of 2018.
One very useful feature of the yield curve is that it has been a leading indicator of a future recession, with a 1-year lead ahead of the economy. If that relationship is maintained in the current cycle then there is still some time to go before the next recession is upon us. It is also worth considering that while the yield curve has been an excellent indicator of the last 4 recessions and indeed many of the recession before then, it is only a measure of consensus sentiment. An unexpected event could flatten or invert the yield curve more quickly than has happened in the past.
Chris Riley, RSMR
December 2017