

As factor investing becomes more popular, the search intensifies for new factors. This month we examine a less well-known factor: The Asset Growth anomaly. We examine the claim that there is a premium for investing in stocks with low asset growth. We find that the premium is generated by avoiding high asset growth stocks, which have both low returns and high volatility. The pattern of returns suggests that while high and low asset growth stocks often perform similarly in market crashes, high asset growth stocks can do significantly worse for example in the aftermath of the tech stock boom.
Key issues this month:
There has been a penalty for investing in high asset growth stocks over the last 30 years, with these stocks only providing 5% return per annum.
High asset growth stocks provided the highest volatility of returns with a standard deviation of 20% per annum.
The stocks with high asset growth performed extremely poorly during the tech stock bust period of the early 2000s.
Analysis of Returns
The chart below shows the compound annual returns of stocks sorted by the asset growth factor. Asset growth is defined as the percentage change in total assets over the previous year. Stocks in decile 1 have the lowest rate of asset growth, while stocks in decile 10 have the highest rate of asset growth. We use the last 30 years of data, to cover several market cycles.
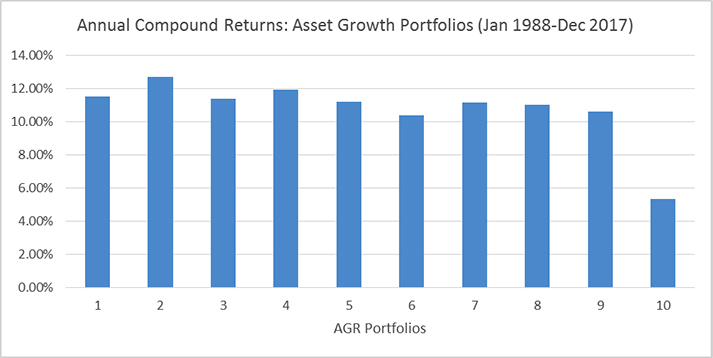
Figure 1: Data taken from Ken R French Data Library
The highest compound return was provided by AGR portfolio 2 of 12.7%. The other remaining portfolios all provided performance in between 10-12% per annum, aside from the highest AGR portfolio 10, which provided returns of only 5.4% per annum. In summary, annual compound returns suggest that there is a penalty of around 5% per annum for investing in stocks with the highest asset growth. The other asset growth portfolios all provide broadly similar rates of return.
The next chart shows the annual volatility of the AGR portfolios. Data is again shown for the last 30 years. Higher volatility portfolios can be undesirable for investors, as their capital value will fluctuate more.
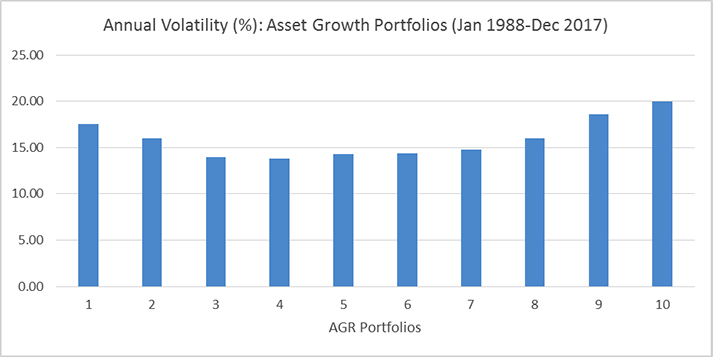
Figure 2: Data taken from Ken R French Data Library
The chart suggests that the lowest risk AGR portfolios are those in the middle. AGR portfolios 3 and 4 are the only ones with volatility below 14%. The AGR portfolio with the highest volatility is AGR portfolio 10 with a standard deviation of just over 20% per annum. In summary, AGR portfolio 10 has the lowest returns of all the AGR portfolios and the highest volatility. Returns and risk suggest that the Asset Growth premium comes from avoiding the stocks with the highest asset growth, rather than actively investing in stocks with the lowest asset growth.
The Pattern of Returns
Having looked at annual returns and established that asset growth stocks have undesirable properties, we now examine the pattern of returns. The 30-year data sample period provides several market cycles by which the performance of the AGR portfolios can be analysed. The chart below shows the annual performance of 2 portfolios: AGR portfolio 1 and AGR portfolio 10.
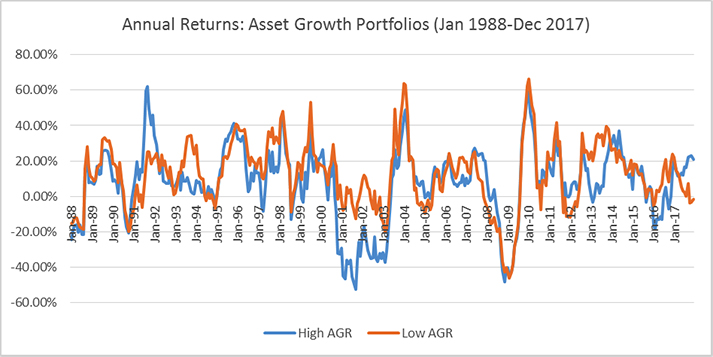
Figure 3: Data taken from Ken R French Data Library
The three market cycles in the data sample occurred in the early 1990s, early 2000s and 2008. Of the three market cycles, it seems that low AGR stocks only did better in the early 2000s correction. This correction was driven by a bursting of a bubble in technology stocks and it may be that many of these stocks had high rates of asset growth. In the other 2 corrections of the early 1990s and 2008, low AGR stocks seemed to have performed just as poorly as high AGR stocks and hence provided little protection. The low AGR stocks have, however, outperformed high AGR stocks in normal market conditions.
Conclusion
This month we moved away from the analysis of conventional factors such as value, momentum or quality by examining the Asset Growth anomaly. We found that while low asset growth stocks have outperformed high asset growth stocks, this is mainly due to the poor performance of high asset growth stocks. Hence there appears to be a premium in avoiding high asset growth stocks. The volatility of high asset growth stocks is also high and generally undesirable. They performed extremely poorly during the correction after the tech stock boom in the early 2000s. In other market cycles, however, high asset growth stocks have fallen by a similar amount to low asset growth stocks.
With smart beta and factor investing becoming more popular and overcrowded, investors would do well to consider less well known factors such as the Asset Growth factor, which our data suggests has been a driver of factor returns over the last 30 years.
Chris Riley, RSMR, April 2018