

A couple of months ago, I examined the volatility factor and discovered that it tends to outperform during market corrections, but underperforms dramatically during recoveries. This month, I look at the momentum factor. In particular, I investigate how the momentum factor performs in different stages of the market cycle. The analysis suggests that momentum stocks provide strong absolute returns and also an appealing pattern of returns for investors, with strong downside protection during market corrections.
Key issues this month:
- High momentum stocks have outperformed low momentum stocks over the 40 year sample period by a significant margin.
- Momentum performs well in recessions, but poorly in market recovery periods.
- High momentum stocks have a lower volatility than low momentum stocks, providing a smoother ride for investors.
Cumulative Returns
To begin with I will look at how the momentum factor has performed over time in terms of cumulative returns. The chart below shows the performance of $1 invested in either a high momentum strategy (orange line) or low momentum strategy (blue line). Momentum is defined as the performance of the stock over the last 12 months, excluding the most recent month. To calculate the high momentum portfolio I take the top 30% of stocks with the highest price momentum in the US market. The low momentum portfolio is calculated using the bottom 30% of all stocks in the US market ranked by price momentum.
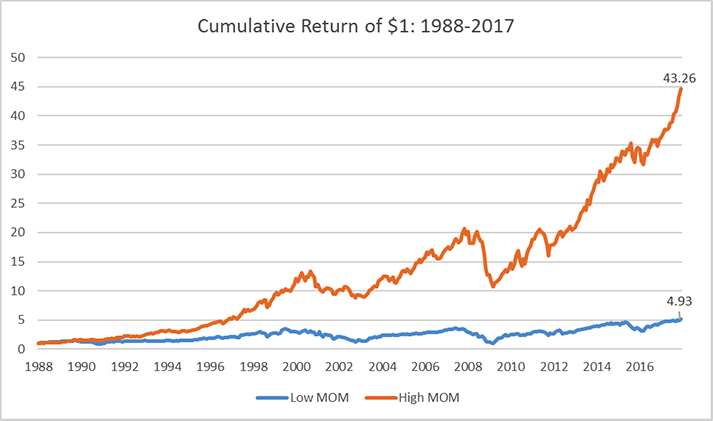
Figure 1: Data taken from Ken R French Data Library
The chart shows that $1 invested in high momentum stocks would have far outperformed a dollar invested in low momentum stocks over the last 40 years. The dollar would have grown to $43.26 if invested in high momentum stocks, while it would have grown to only $4.93 in low momentum stocks. Now that I have established the historical outperformance of high momentum stocks, the next section uses annual returns to examine the pattern of performance.
"In addition to the high level of return provided, the pattern of returns that momentum generates is likely to be appealing to many investors."
Annual Returns
The chart below shows the annual percentage returns of the portfolio of high momentum stocks and low momentum stocks, within the US market. The orange line again represents high momentum stocks and the blue line represents low momentum stocks.
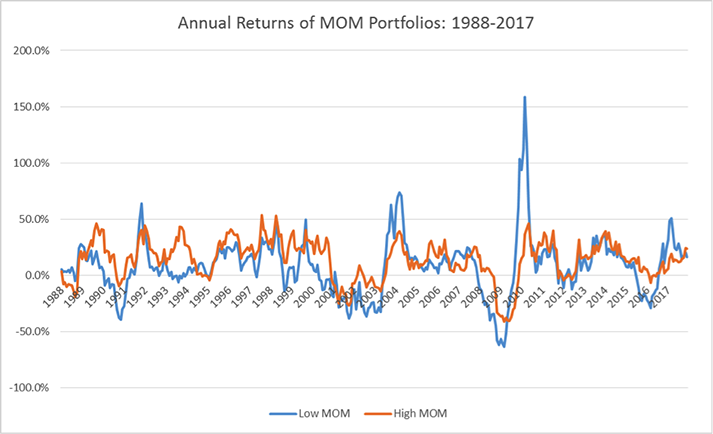
Figure 2: Data taken from Ken R French Data Library
There are 3 distinct patterns to notice in the annual return chart above. The first thing is that momentum has performed very well in recessions. Examining the 3 drawdowns in the sample period: 1991, 2002 and 2008, high momentum stocks have outperformed low momentum stocks in all 3 periods (the orange line is above the blue line). This suggests that high momentum stocks provide downside protection in market drawdowns.
The second point to note is that high momentum stocks have performed poorly in subsequent recoveries. This has been the case across all 3 recovery periods after the drawdowns, but was especially pronounced in the recovery following the 2008 crash where Low MOM stocks outperformed strongly. This pattern of downside protection followed by underperformance in recoveries is similar to the low volatility factor that I examined a couple of months ago.
The final point to note is that the volatility of high momentum stocks has been lower than that of low momentum stocks. The annualised volatility of high momentum stocks was 18% across the 40 year sample period, whereas it was 26% for low momentum stocks. This suggests that high momentum stocks provide a far smoother ride for investors than either low momentum stocks, or the market in general.
Conclusion
The cumulative return chart shows that high momentum stocks have provided strong returns for investors over the last 40 years, with a $1 investment growing to over $43 over the sample period. In addition to the high level of return provided, the pattern of returns that momentum generates is likely to be appealing to many investors. In particular, the downside protection provided by momentum in previous market corrections and the low standard deviation of returns. Given the current late market cycle conditions, momentum would appear to be an ideal smart beta factor for the current conditions based on the historical evidence.
Chris Riley
RSMR
January 2018