

Is there any useful information in past share prices that practitioners can incorporate into factor portfolios? This month we examine behavioural reasons why investors might undervalue short-term outperformance while overvaluing long-term outperformance. We then analyse the performance of factor portfolios that are designed to exploit these biases and find evidence of strong and consistent outperformance for both short-term and long-term strategies.
- Investors expect short-term patterns to reverse, leading to price momentum in share prices
- Investors expect long-term patterns to continue, leading to long-term reversal in share prices
- Both price momentum and long-term reversal factors have been strong and consistent predictors of future returns
The Law of Small Numbers
Investors seem to use the law of small numbers when forming their expectations of future returns. Investors exaggerate the importance of a short sequence of numbers, believing that a short sequence is fully representative of the long-run pattern of the sequence.
In the short-run, this leads to a bias called the gamblers fallacy. The gamblers fallacy is the belief that early draws of one signal lessen the chances that it will be drawn again. Imagine a situation in which you rolled the number six 3 times in a row on a fair dice. The gamblers fallacy would suggest that there is a lower probability that six will be rolled versus the other numbers, in the subsequent roll. Actually, this is not the case as the number six still has a 1/6 probability of being rolled in the subsequent roll, as every roll is an independent event.
"Stocks that have outperformed over the recent year, but underperformed over the last 5 years have historically outperformed stocks with opposite characteristics by a wide margin."
In the long-run, belief in the law of small numbers leads to the hot-hand fallacy. Now imagine a situation in which you rolled 10 sixes in a row on the dice. The probability of such a series of outcomes happening is quite low and might suggest there is a pattern in the data, even if the pattern was simply due to luck. The dice could be loaded towards the number sixfor example. The hot-hand fallacy is a belief that the pattern will continue, with no underlying evidence for that belief.
Further information on the Law of Small Numbers, Gamblers Fallacy and Hot Hand Fallacy can be found in: Rabin, M., & Vayanos, D. (2010), The gambler's and hot-hand fallacies: Theory and applications.
Short-term Momentum
The gamblers fallacy can explain short-term momentum in the share market, where prior outperformers tend to continue to outperform and prior underperformers tend to continue to underperform. The reason is that investors expect short-term patterns to reverse themselves. This belief leaves past outperformers undervalued relative to past underperformers and hence sows the seed for the subsequent strong performance of past outperformers.
The chart below shows the performance of stocks in the US equity market ranked by price momentum. Price momentum is defined as prior performance over the past year, excluding the latest month. The stocks with the lowest performance over the last year are placed into momentum decile 1, while the stocks with the highest performance are placed in decile 10. The chart shows that the subsequent performance of past winners in decile 10 is around 25% per annum, while it is under 15% for past losers. The pattern of outperformance of past winners is also remarkably consistent across the momentum deciles.
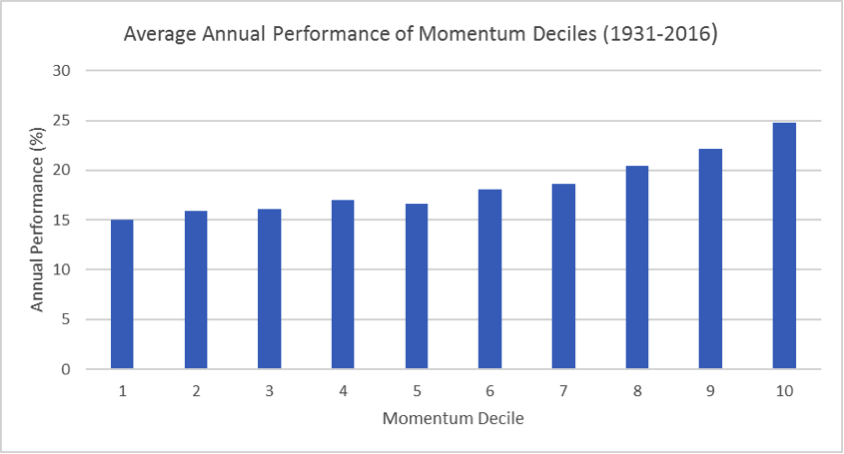
Figure 1: Data taken from Ken R French Data Library
Long Term Reversal (LTR)
The hot-hand fallacy leads investors to favour long-term outperformers over long-term underperformers. They believe that long-term outperformers are good investments that are likely to continue to outperform in the future. This can be a dangerous belief when it is not rooted in an analysis of prospects for the business, but solely on past performance. The bias towards long-term outperformers and against long-term underperformers again affects the relative valuation of these securities.
"This can be a dangerous belief when it is not rooted in an analysis of prospects for the business, but solely on past performance."
The chart below shows the performance of US stocks ranked by their previous past performance into LTR decile portfolios. LTR is defined as prior performance over the past 5 years minus the last year. We see the opposite pattern of performance generated by momentum deciles earlier. Past losers (LTR decile 1) average subsequent performance of 30% per annum, whereas past winners have far lower performance of around 12% per annum.
Figure 2: Data taken from Ken R French Data Library
Conclusion
Investors believe that short-run patterns of performance will reverse, whereas long-run patterns of performance will continue. These beliefs have an impact on the relative valuation of securities in the marketplace.
Stocks that have outperformed over the recent year, but underperformed over the last 5 years have historically outperformed stocks with opposite characteristics by a wide margin. The quantitative evidence suggests that investors have very negative beliefs around stocks these stocks, which leave them under-priced.
Factor portfolios that look to exploit irrational beliefs regarding share price patterns would have been very successful on a historical basis and have the potential to outperform in the future, provided that investors continue to exhibit the same behavioural biases.
-
Chris Riley
RSMR
June 2017