
The Best Performing Smart Beta Factors
As smart beta investing becomes more popular with investors, a long-term appraisal of factor performance would be useful to help to understand funds which operate in this way. Although the factors move in and out of favour on a short-term basis, the efficacy of the strategy is best appraised through long-term analysis. We look at the performance of six of the most common factors and find that the traditional factors such as value, momentum and size have performed the best in term of raw performance. When volatility is considered however, the low volatility factor has provided the highest levels of risk-adjusted returns.
- Value is the best performing smart beta factor over the last 52 years
- Low volatility and high yield are the lowest risk factors
- On a risk-adjusted basis, volatility and value are the best performing smart beta factors
Long-term Performance
The chart below shows the annual performance of six of the most common smart beta factors available in the marketplace. Variables used to calculate the smart beta factors are taken from the Ken French Data Library. For example, the value smart beta factor is calculated from the decile of stocks with the highest book-to-market equity ratio. The data goes back 52 years, which is the longest available for many of the factors.
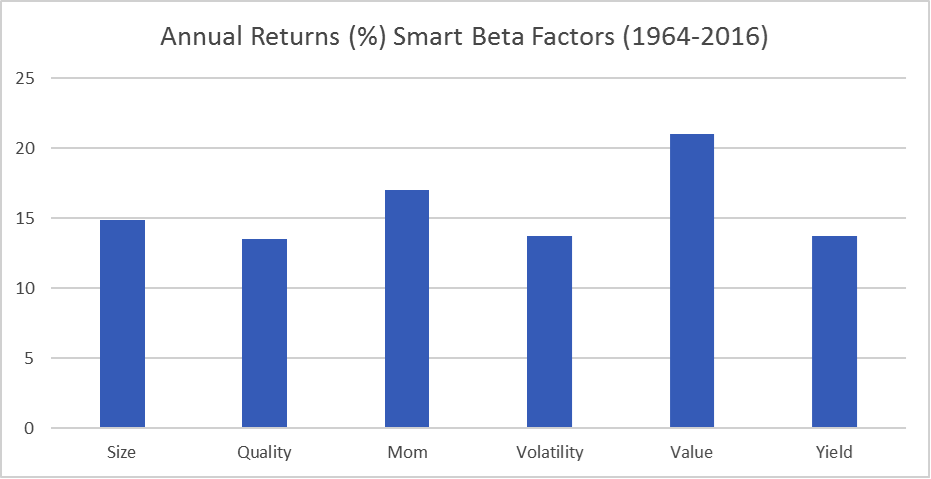
Figure 1: Data taken from Ken R French Data Library (US data)
The best performing factor over the last 52 years has been value, with a compound annual return of over 20% per annum. Momentum and size have been the next best-performing factors. Relatively new factors such as quality and low volatility have been the worst performers, which perhaps explains why it took longer to identify them in the data than the more traditional factors.
"Our analysis shows that the traditional factors such as value, momentum and size have been the best performers, in terms of raw performance."
Risk Adjusted Performance
Raw performance numbers only give us part of the story, as we should also consider the level of risk taken to achieve the performance. The chart below shows the annual standard deviation of monthly returns of the 6 factors, across the 52 year period.
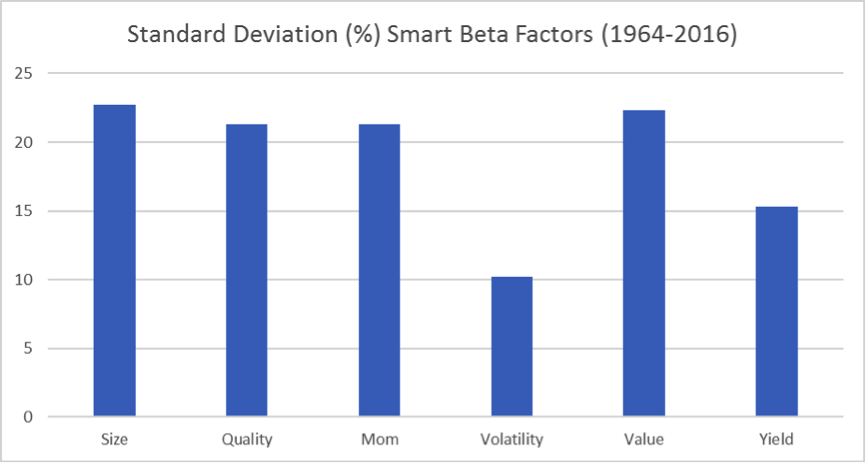
Figure 2: Data taken from Ken R French Data Library (US data)
The size factor has the highest standard deviation of all the factors. This is not surprising given the exposure to small companies, which carry a high amount of risk. It is also no surprise to see the low volatility factor provides the lowest risk. This factor invests in low volatility companies by design. The other factor to provide low volatility is a high yield strategy.
We can bring together the raw performance numbers with the risk numbers to calculate risk-adjusted performance, in the form of the Sharpe ratio. The Sharpe Ratio is calculated by subtracting a risk-free rate from the raw performance and dividing by risk. The chart below shows the Sharpe ratio of the 6 factor strategies over the 52 year period. In this instance, we assumed a risk-free rate of 4% per annum.
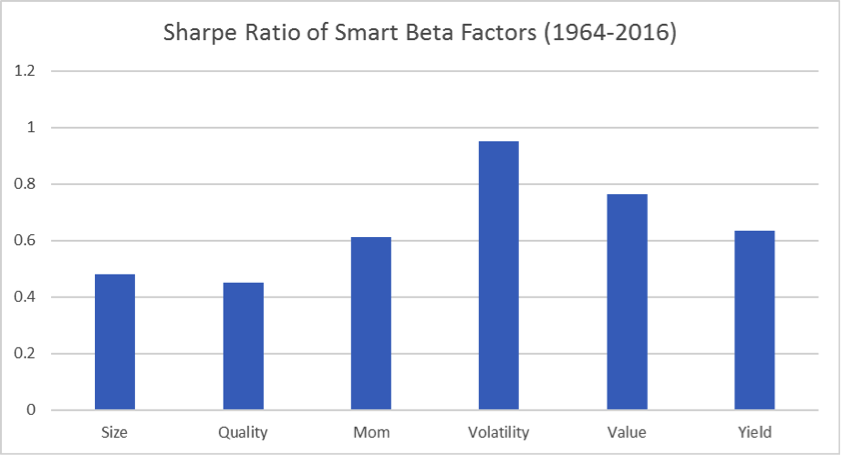
Figure 3: Data taken from Ken R French Data Library (US Data)
The low volatility factor has provided the highest Sharpe ratio. This is due to the fact that it provides reasonable levels of returns at very low levels of volatility. The value factor provided the second highest Sharpe ratio, mainly because raw returns have been so high. The quality factor provided the lowest Sharpe ratio. This factor has produced mediocre returns at fairly high levels of volatility relative to the other factors.
Conclusion
Whilst all smart beta factors are becoming more popular, some factors have performed better than others. Our analysis shows that the traditional factors such as value, momentum and size have been the best performers, in terms of raw performance.
Many investors will also want to consider how bumpy the performance ride has been in reaching the performance level. In this regard, the low volatility factor really stands out from the others by providing a reasonable level of return and a low level of risk. On a risk-adjusted basis, the low volatility factor is the top performer.
-
Chris Riley
RSMR
May 2017