

The yield curve gap has been a powerful and accurate predictor of recessions over the last 40 years. This month, we examine the recent movements in the yield curve and the implications of the shape of the yield curve for the economy and stock market. We find that the yield curve is due to flatten in the early part of next year. Based on lags in previous cycles, this implies a recession in the 2nd half of 2020 and a stock market top towards the end of 2019.
Key issues this month:
- The yield curve gap of 0.15% is the lowest we have seen since June 2007.
- The curve is due to flatten around Easter 2019. Recessions have usually followed within 1-2 years of the curve flattening.
- Looking globally, Canada, Japan and India have the flattest yield curves.
“The evidence from the yield curve suggests that this period of expansion is drawing to a close, but that a recession may still be avoided in 2019.”
The US Yield Curve
We begin with an examination of the US Yield Curve. The USA is the world’s biggest economy and it can often lead other economies such as the UK. The chart below shows the yield curve gap for the US economy, calculated by subtracting the yield on 10-year US treasury bonds from the yield on 2-year treasury bonds.
The chart features a total of 4 previous recessions (treating the early 80’s double dip as a single recession), shown by the shaded grey bars. Each of the previous 4 recessions have been preceded by a flattening of the yield curve. The yield curve tends to be flat at these times for two reasons. Firstly, the Federal Reserve is often in tightening mode at the end of the economic cycle, which causes short-term rates to be higher than usual. Secondly, concerns around economic growth towards the end of the cycle tend to reduce long-term rates below their normal level. The combination of upward pressure on short-term rates and downward pressure on long-term rates leads to a flattening of the curve.
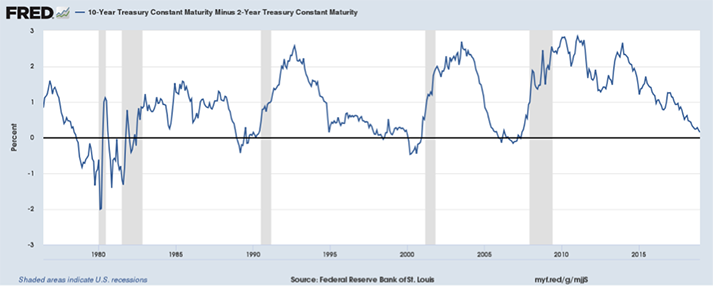
Figure 1: Chart generated from FRED database
The chart shows that we are near the end of a tightening cycle from the Federal Reserve, with the yield curve approaching a flat position. This cycle has been unusual in its very long length and the fact that it was preceded by a very long recession that started in 2008. To examine yield curve changes in recent months, our next chart shows the yield curve gap over the last year.
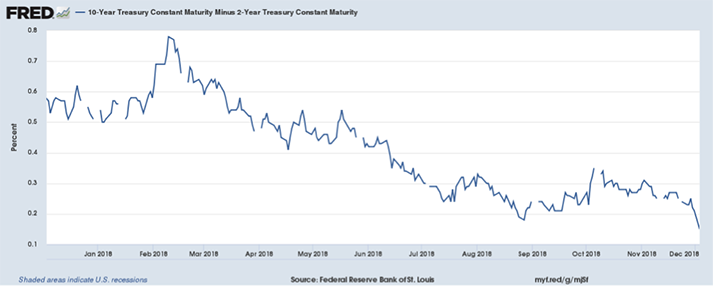
Figure 2: Chart generated from FRED database
The Fed has been gradually raising interest rates this year and the yield curve gap has been in decline. Rate tightening is due to continue into next year. At the current rate of decline, the yield curve is due to flatten by around Easter of 2019. Typically, we find that recessions lag the point of the yield curve first flattening by a period of between 1 and 2 years. So based on typical patterns, we might then expect a recession in the US, in the 2nd half of 2020.
The share market tends to anticipate recessions and correct ahead of them. It has led recessions by an average of 10-months in the last 4 recessions, with the lead factor depending on the nature of the cycle. In the tech stock boom, for example, the collapse in tech stocks came almost two years before a recession was officially announced. In the last recession, of 2008, the market topped around 7 months before the recession began. Using the average 10-month lead period would suggest a market top will occur around late 2019.
Other Major Economies
In this section, we look at the yield curve gap of 8 major countries, or economic areas in the case of the Euro. The table below shows the 10 year and 2-year bond yields for each country, along with the yield curve gap which is again calculated by subtracting the 2-year yield from the 10-year yield. The countries are sorted by reverse order in terms of yield curve gap.
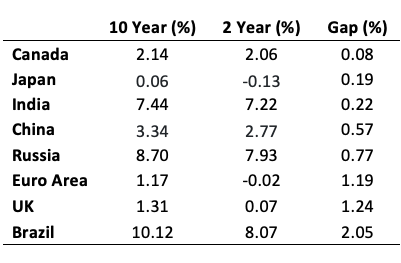
The major change this year has been the worsening position of Canada and India. Canada now has the flattest yield curve of the major economies, overtaking Japan from last year. The yield curve gap of India has also declined from a spread of 48bps last year to 22bps this year. The yield curve position of other major economies has improved, however. The yield curve in China has widened by around 20bps over the last year to 57bps, while it has also widened in Russia, the UK and Brazil. In summary, the international economy presents a mixed picture of tightening and loosening conditions this year, with Canada, Japan and India looking the most vulnerable.
Conclusion
This cycle has been unusually long in duration after a sharp fall in the economy in 2008. The evidence from the yield curve suggests that this period of expansion is drawing to a close, but that a recession may still be avoided in 2019, assuming a typical delay between the flattening of the yield curve and subsequent recession. The equity market, however, tends to anticipate recessions and so a top may well be reached towards the end of 2019 with a recession in the 2nd half of 2020. All the above assumes that the usual relationships that we see between the yield curve, economy and equity markets remain in place.
Chris Riley, RSMR, December 2018