

This month, we turn our attention to the value premium, which is one the most popular and well-known factors. We begin by examining the cumulative return of investing in two common value portfolios and show that the returns have been far in excess of the market, although this has come with a higher level of volatility. We then look at the pattern of returns. Value stocks tend to underperform in market recessions but outperform in subsequent recoveries. This provides quite a volatile experience for investors, although the returns from investing in heavily beaten-up stocks in recoveries can be rewarding.
Key issues this month:
- Value stocks have outperformed the market over the last 30 years, with high price-to-earnings stocks leading the way.
- Value stocks have a higher volatility than the general market, which means they provide a bumpy ride for investors.
- During a recession, value stocks tend to underperform the market, but they outperform in the subsequent recovery.
Cumulative Returns
The chart below shows the performance of $1 invested over the 30 year sample period, which covers 3 recessions in the early 90s, 2000 and 2008. The general market, which represents the market cap index of all stocks is represented by the blue line. Two value metrics are also included in the graph. Stocks in the top decile ranked by earnings-to-price ratio (E/P) are shown by the orange line, while stocks with high book-to-market ratio (B/M) are represented by the grey line. A high level of earning per share or book value per share to price are generally regarded as measures of value.
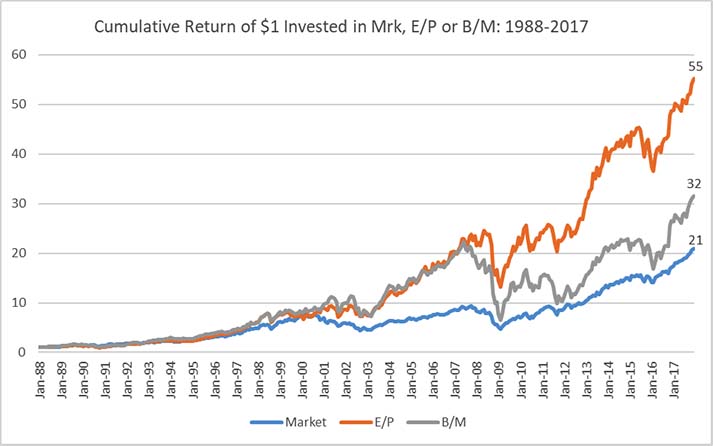
Figure 1: Data taken from Ken R French Data Library
As represented by the blue line, $1 invested in the market would have grown to $21 by the end of the 30 year period. This represents a return of around 10.5% per annum. The performance of the top decile of value stocks outperformed the market, however. $1 invested in high B/M stocks would have grown to $32 over the same period, or $55 if invested in the top E/P stocks.
"Overall, the pattern seems to be one of value stocks doing badly in a recession but outperforming the market in a subsequent recovery."
In terms of volatility, both of the value portfolios look more volatile than the market, with big drops in the 2008 period. The annualised volatility of the market was 14% over the period, versus 18% for E/P stocks and 22% for the top decile of B/M stocks. This confirms that value investing provides a bumpier ride for investors, which may go some way to explain the higher return for these stocks, as investors require a greater return as compensation. The section below moves on to explore the pattern of returns provided by value stocks.
Annual Returns
The chart below shows the annualised return for the market and the two value portfolios over the same 30 year period. The market is again represented by the blue line, with E/P represented by the orange line and B/M by the grey line. There are 3 recessions over the 30 year period in 1990, 2000 and 2008, where performance across the 3 portfolios can be examined.
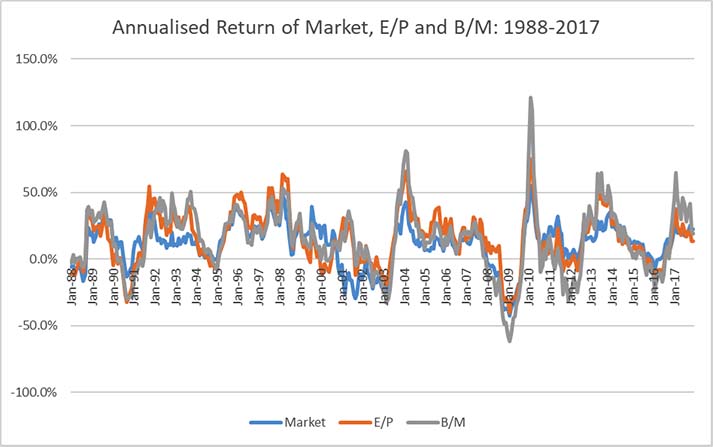
Figure 2: Data taken from Ken R French Data Library
In the first recession of the early 1990’s, it is quite clear that both value portfolios perform worse than the market. In the subsequent recovery, value stocks outperform the market with high E/P stocks the first to recover. This pattern is mirrored in the recession in the early 00’s, although value stocks did well in the initial phase of the recession. This perhaps reflects the fact that this recession was preceded by a bubble in growth-like technology stocks. Once the recovery was underway, value stocks again led the market with high B/M stocks doing particularly well. This same pattern was in place for the 2008 recession and recovery. High B/M stocks did particularly badly during the recession and then had a far stronger recovery than the market. The pattern was less pronounced in high E/P stocks. Overall, the pattern seems to be one of value stocks doing badly in a recession but outperforming the market in a subsequent recovery.
Conclusion
A couple of months ago, we looked at the performance of high momentum stocks and found that they offered protection in a recession, but sometimes underperformed in a subsequent recovery. Value stocks appear to provide the opposite pattern of performance, with underperformance in a recession, but outperformance in a recovery. This pattern of returns does not seem that appealing for investors, who would typically look for some protection in a recession. On the whole, it seems that value investors are brave individuals who can profit in bombed-out stocks after big market falls, but these gains do not come without high levels of risk and volatility.
Chris Riley, RSMR
March 2018