

The reasons for the existence of factor premiums is hotly debated. Those in the mispricing camp believe that factor premiums exist because investors misprice stocks, while those in the risk-based camp believe that premiums exist because some stocks are riskier than others. The debate matters because if the mispricing camp are correct then it suggests that the factors could ultimately be arbitraged away by high flows into smart beta products. This month, we examine the evidence for both camps by analysing the cause of the value premium. We find that there is evidence to support both explanations, although the mispricing argument has the more unequivocal evidence.
Key issues this month:
- Value stocks have outperformed growth stocks over the last 50 years in the US market.
- There is some support for a mispricing argument in that stocks with poor past performance (most commonly value stocks) tend to have high subsequent returns.
- The support for a risk-based argument is mixed, as value stocks do suffer high standard deviation of returns, but growth stocks have a higher annual drawdown.
“We find that there is evidence to support both explanations, although the mispricing argument has the more unequivocal evidence.”
The Value Premium
To begin with, we examine the size of the value premium. The table below uses US stocks over the last 50 years. Stocks are sorted into 10 decile buckets based on their book-to-market ratio. High book-to-market ratio stocks are placed into decile 1, while low book-to-market ratio stocks are placed into decile 10.
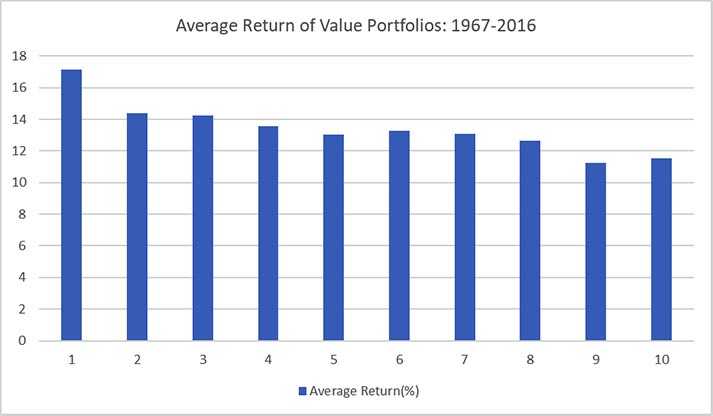
Figure 1: Data taken from Ken R French Data Library
Figure 1 suggests an almost monotonic relationship between value and annual stock returns. Value stocks (decile 1) have the highest annual return of around 17% per year, while the lowest value stocks (decile 10) have a low annual return of under 12% per year. So, the question is: what is driving these returns? In the remaining two sections, we discuss the two alternative hypotheses.
The Case for Mispricing
If mispricing is causing the value anomaly then we might expect investors to have a negative sentiment towards value stocks, which leaves them under-priced. One way to explore this is to look at the relationship between past and future returns. It is reasonable to suppose that investors have negative sentiment towards the stocks with the lowest long-term performance, which are also more likely to be cheap, value stocks. The chart below shows the performance of US stocks that are split into deciles based on their performance over the past 5 years, excluding the latest year. Decile 1 stocks have the lowest long-term performance (LTR), while decile 5 stocks have the highest LTR.
Figure 2: Data taken from Ken R French Data Library
Figure 2 suggests that the stocks with the poorest performance do indeed go on to have the strongest returns in the subsequent year. The stocks with the lowest LTR in portfolio 1 have an annual return of close to 17% in the subsequent year, while stocks in portfolio 10 have a returns of under 12%. This provides some support for the mispricing argument, as it suggests that value stocks may be under-priced by investors due to poor performance in the previous 5 years.
The Case for Risk
To make the case for a risk-based argument we explore the standard deviation and maximum annual drawdowns on the value decile portfolios created in Figure 1. The chart below shows the risk information for the 10 decile portfolios, with portfolio 1 again representing value stocks and portfolio 10 growth stocks. Standard deviation of returns are shown by the blue bars and the maximum annual drawdown is shown by the orange bars.
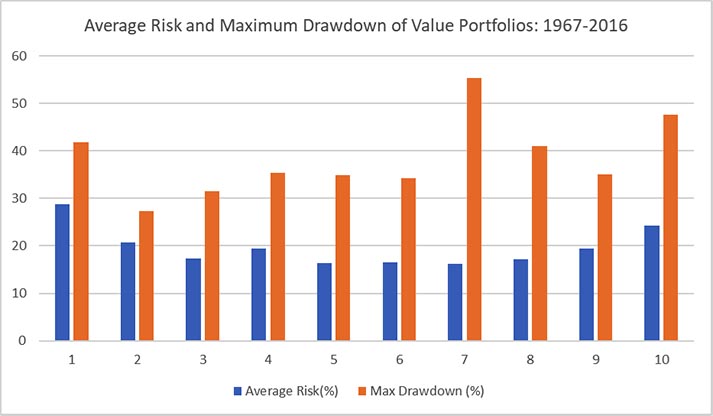
Figure 3: Data taken from Ken R French Data Library
In terms of standard deviations, value stocks in portfolio 1 do have the highest standard deviations at nearly 30%. The relationship is by no means linear, however, as it appears to follow more of a u-shape with growth stocks also having a high standard deviation. In terms of maximum annual drawdown, there appears to be little relationship between risk and value portfolios. The highest annual drawdown is provided by portfolios 7 and 10, which are comprised of growth stocks, although portfolio 1 has the next highest annual drawdown. In summary, there is some evidence that value stocks are riskier in the form of standard deviation of returns and they also suffer fairly high annual drawdowns.
Conclusion
There is a strong relationship between the value premium and annual stock returns and we showed that annual return increases in line with the book-to-market ratio. We then explored 2 possibilities for the existence of the value premium: mispricing or risk. There is strong support for the mispricing argument, as stocks with poor long-term performance (typically value stocks) tend to outperform in the future. This suggests that investors have negative sentiment towards these stocks. We also found some evidence to support the risk-based argument as value stocks have a high annual standard deviation of returns and fairly high annual drawdowns. Overall then, there is some support for both arguments, which is why the debate continues in the literature.
Chris Riley, RSMR, July 2018